Unit I: Production Possibilities Graphs (PPGs)
Before we get into production possibilities graphs, we must become familiar with two terms:
Trade-offs are alternate decisions that people make when they have an economic dilemma.
Opportunity cost is the most desirable alternative given up by people when making a decision.
A production possibilities graph, or PPG, is a graph that shows alternative ways to use an economy's resources.
A production possibilities curve (PPC), also known as a production possibilities frontier (PPF), is the line the one the graph that shows the production.
- Any point on the curve, such as points A, B, and C below, indicates that production of is attainable and efficient.
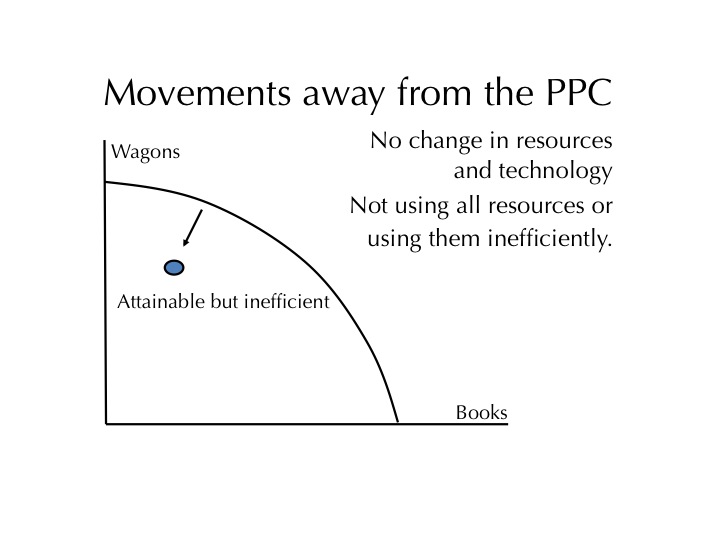
- Any point inside the curve, such as point X below, indicates that production is attainable but inefficient. This could be due to underutilization, unemployment, underemployment (not using all of your resources efficiently) and could also mean we're entering a recession.
- Any point outside the curve, such as point Y below, indicates that production is unattainable. This could be due to either economic growth or technology.
:max_bytes(150000):strip_icc()/Clipboard01-a1713d1938954eb5b12d7bd46125c415.jpg)
For this to work, some key assumptions have to be made:
- There must be full employment, which equates to 4-5% unemployment and 90% factory capacity
- There must be fixed resources, which includes land, labor, and capital
- There must be a fixed state of technology
- There is no international trade
- Only two goods are being produced
There are three types of movement on the production possibilities curve (PPC):
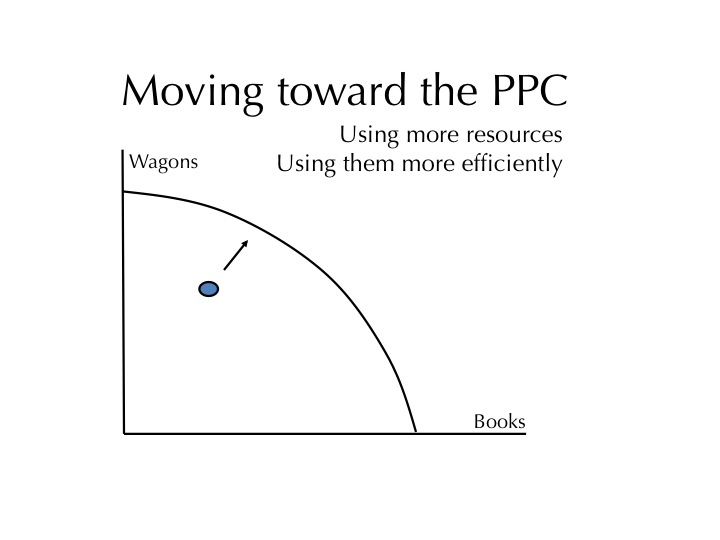
Inside the PPC: resources can be unemployed (no full employment) or underemployed (no productive efficiency)
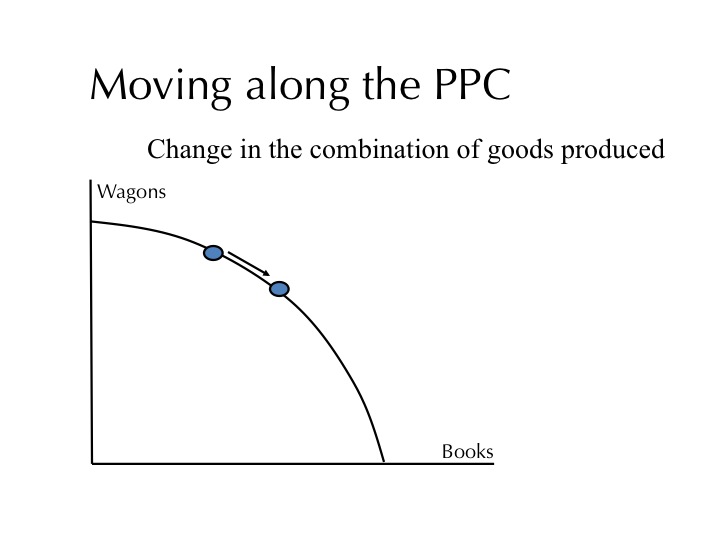
Along the PPC: this results in producing more of one good and less of the other
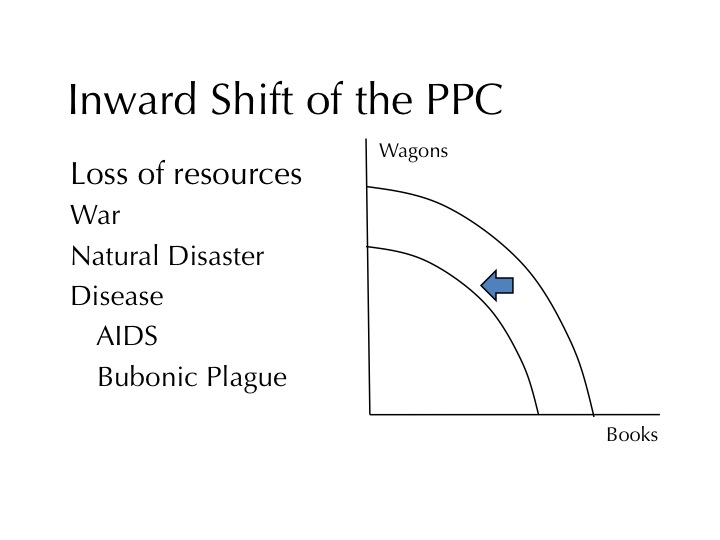
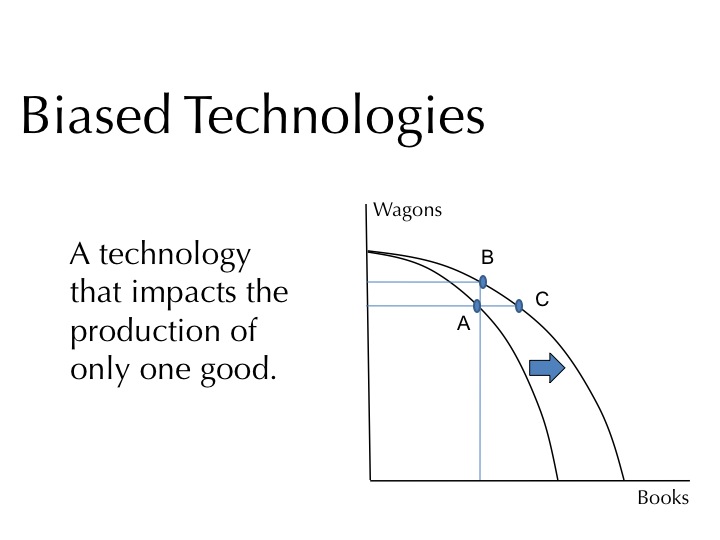
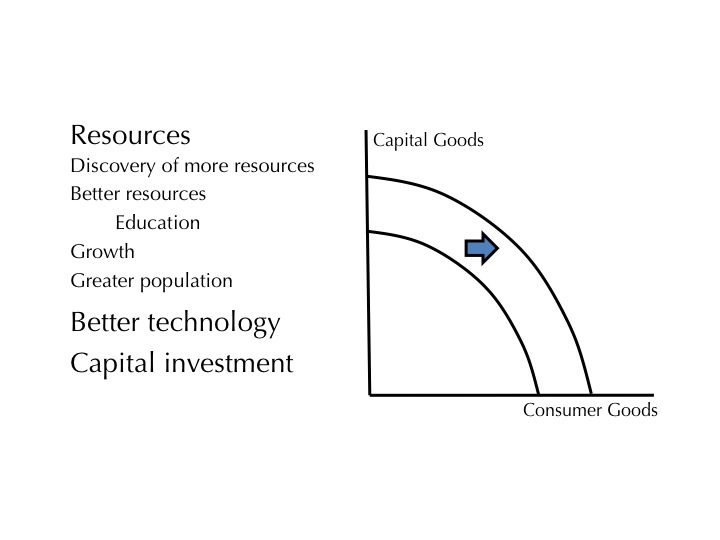
Shifts of the PPC: resources or technology
Some other important terms to know:
Allocative efficiency is when the products being produced are the ones most desired by society.
Productive efficiency is when the products are being produced in the least costly way, which is any point on the PPC.
Underutilization is using fewer resources than an economy is capable of using.
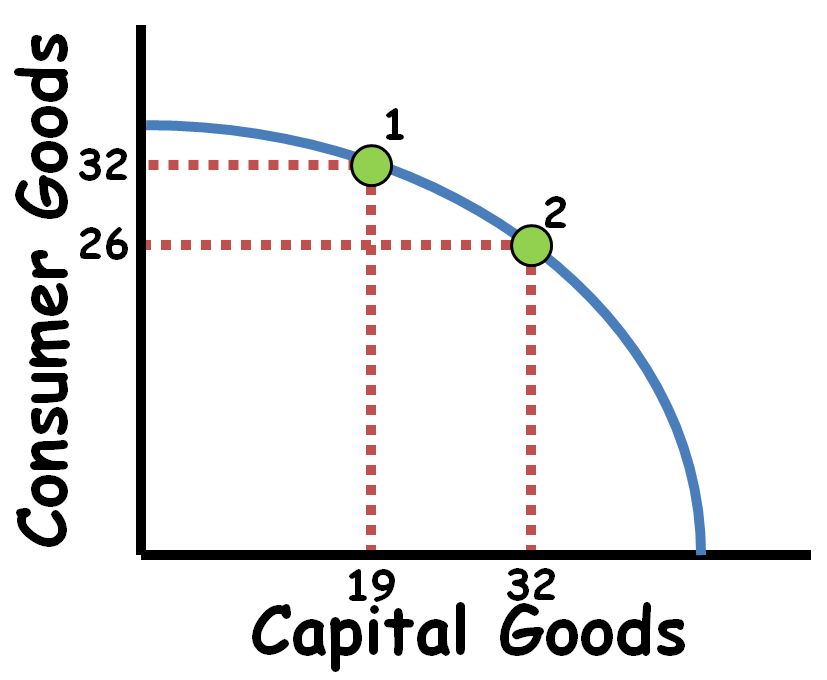
The law of increasing opportunity cost states that as you produce more of one good, the opportunity cost will increase. This results in a concave, or bowed-out, curve on the PPG.
For more information, refer to these videos on Khan Academy:
Production possibilities curve: https://www.khanacademy.org/economics-finance-domain/ap-macroeconomics/basic-economics-concepts-macro/production-possibilities-curve-scarcity-choice-and-opportunity-cost-macro/v/production-possibilities-frontier?modal=1
Increasing opportunity cost: https://www.khanacademy.org/economics-finance-domain/ap-macroeconomics/basic-economics-concepts-macro/production-possibilities-curve-scarcity-choice-and-opportunity-cost-macro/v/increasing-opportunity-cost?modal=1
PPCs for increasing, decreasing, and constant opportunity cost: https://www.khanacademy.org/economics-finance-domain/ap-macroeconomics/basic-economics-concepts-macro/production-possibilities-curve-scarcity-choice-and-opportunity-cost-macro/v/ppcs-for-increasing-decreasing-and-constant-opportunity-cost?modal=1

Your blog is fully detailed and I can see nothing wrong with it. The only thing i would change is to include the five key assumptions which are
ReplyDelete1. full employment
2.fixed resources
3.fixed state of technology
4.no international trade
5.two goods are produced
It's there, under the first graph.
Delete